Analytics and Dashboards
- This section displays the complete reporting system, in this section, you can analyse your reports as per your need.
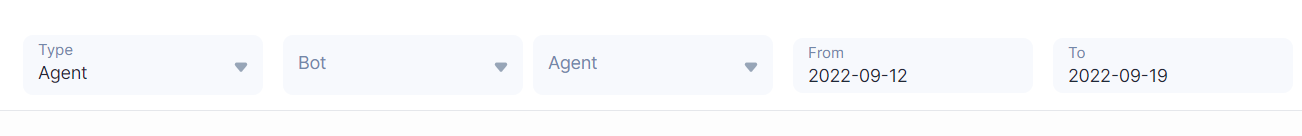
- You can see the required reports by adjusting the provided filters accordingly:
- Type- You can choose what kind of reporting you to want to see Agent, Team, Survey, NLU Engine.
- Bot- Select the bot for which you want to see the interaction.
- Agent- Select the agent or multiple agents for whom you want to see the interactions.
- Date- Select the time frame during which you want to see the interaction.
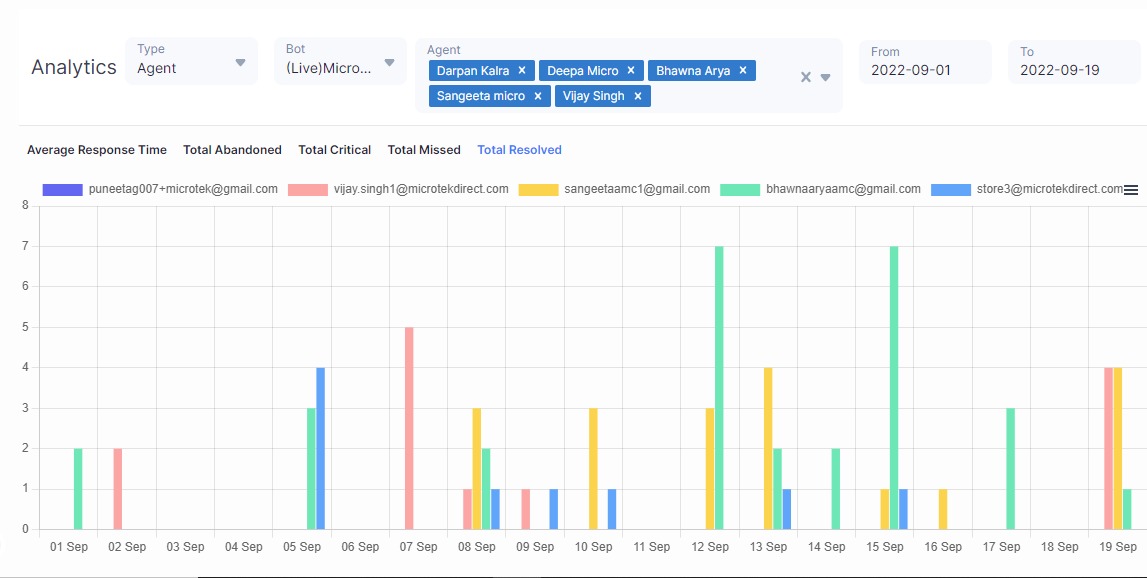
- After selecting the fields, your dashboard will look something like this.
- Here, the X-axis represents the dates you’ve selected.
- Agents are color coded differently so that it is easier to differentiate between them, and their reports can be tracked and understood.
- There are Five types of Reports. These five types of reports cover all the data in a detailed report manner where you can find the required data accordingly.
- The five reports are:
- Average Response Time- Average Response Time (ART) measures the time elapsed between a customer messaging support and an agent replying to it.
Unlike First Response Time, the Average Reply Time includes any time a customer has to wait for a reply. It is not limited to First Touch. - Total Abandoned- Total Number of Abandoned Conversations.
- Total Critical- Critical Issue that the agent has encountered.
- Total Missed- Total issue that has been missed.
- Total Resolved- Total Issue that has been resolved.
Note: all the dashboards, graphs , and charts are dynamic, and they keep on changing with the interaction that the bot has had.
Thank you for your feedback!
We appreciate your feedback!