Short URL Analytics
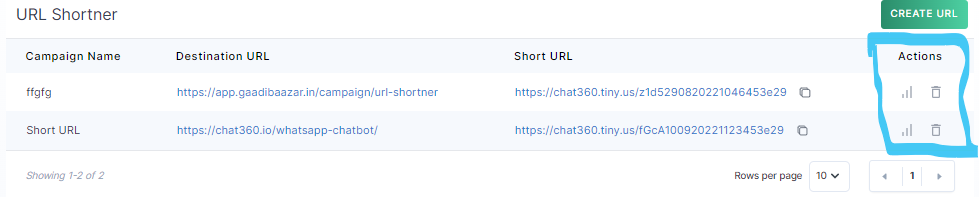
Once created, click the analytics icon next to any link to view its performance:
-
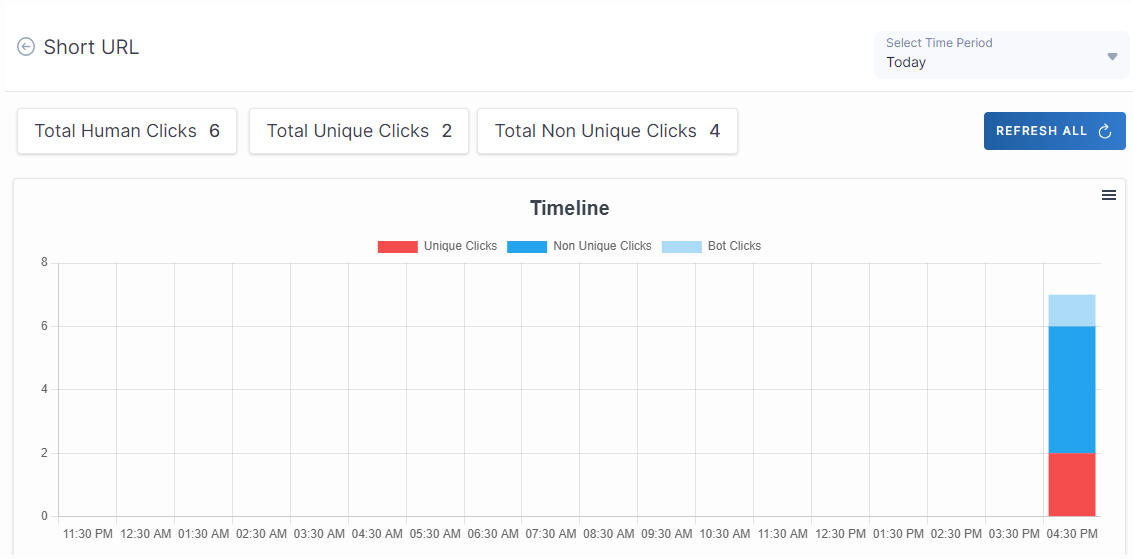
Overview Metrics
- Total Human Clicks: Number of clicks by real users.
- Total Unique Clicks: Count of distinct users who clicked.
- Total Non-Unique Clicks: Repeat clicks by the same user.
-
Timeline Chart
- Shows clicks over time, color-coded by Unique, Non-Unique, and Bot clicks.
- Download the chart as PNG via the chart’s menu.
-
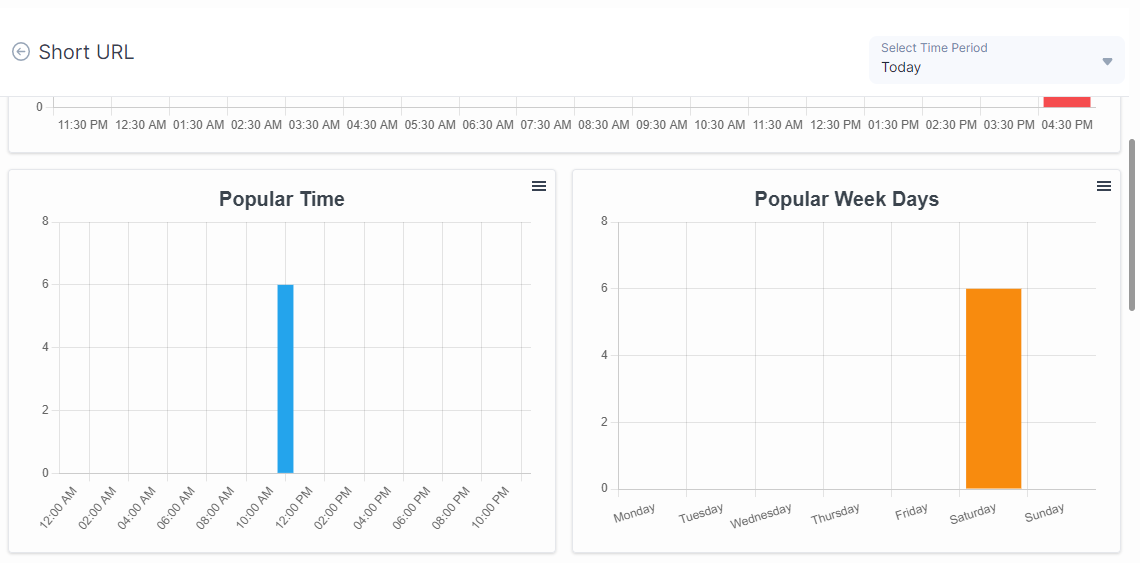
Popular Time & Weekdays
- Popular Time: Bar chart of hour-of-day when clicks peaked.
- Popular Week Days: Bar chart showing which weekdays received the most traffic.
-
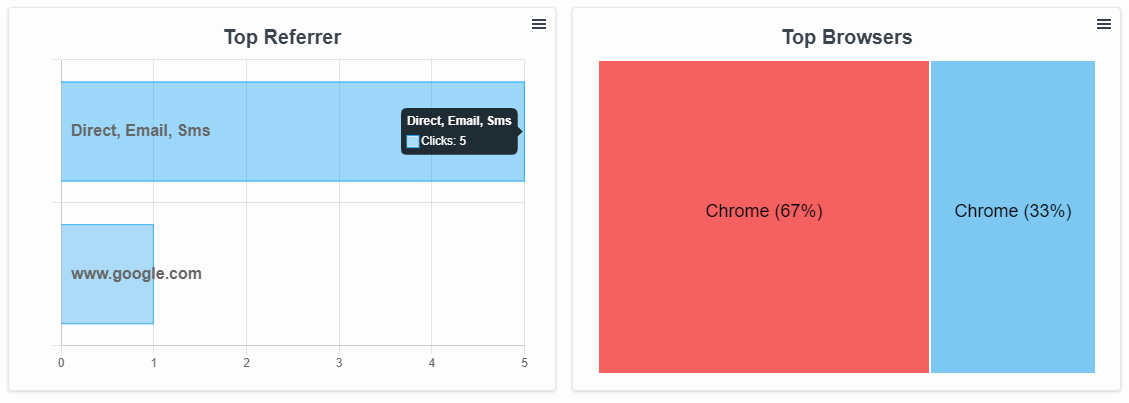
Top Referrers
- Lists sources (e.g., Direct, Email, SMS, Google) bringing users to the link.
- Treemap displaying the share of clicks by browser (e.g., Chrome, Safari).
Usage Guide
- Use the Select Time Period dropdown to filter analytics by today, last 7 days, custom range, etc.
- Click Refresh All to pull the latest click data into your charts and metrics.
- Export individual charts as PNG.
- Export the entire link analytics table as CSV via the table’s Download button.
Key Benefits
- Campaign Tracking: Measure the effectiveness of each digital touchpoint (email, social, SMS) driving traffic to your short link.
- User Insights: Understand when and where your audience clicks, enabling smarter scheduling and targeting.
- Performance Optimization: Identify top referrers and browsers to refine your promotional strategy and improve ROI.
-
1. Select Time Period
By leveraging the URL Shortener feature, teams can create memorable, concise links and gain actionable insights into user behavior, ensuring every campaign drives maximum engagement.
Thank you for your feedback!
We appreciate your feedback!