NLU Engine Analytics
-
Overview:
The NLU (Natural Language Understanding) Engine Analytics dashboard offers a detailed view of how effectively your NLU layer interprets user input and generates responses. It captures intent detection rates, response quality metrics, and system performance data—empowering you to fine-tune your models for more accurate, context-aware conversations and continuously improve user satisfaction.
-
How to Access
- From the left sidebar, click Analytics to expand the menu.
- Select the NLU Engine tab at the top of the analytics page to load the relevant charts and tables.
-
Key Sections
-
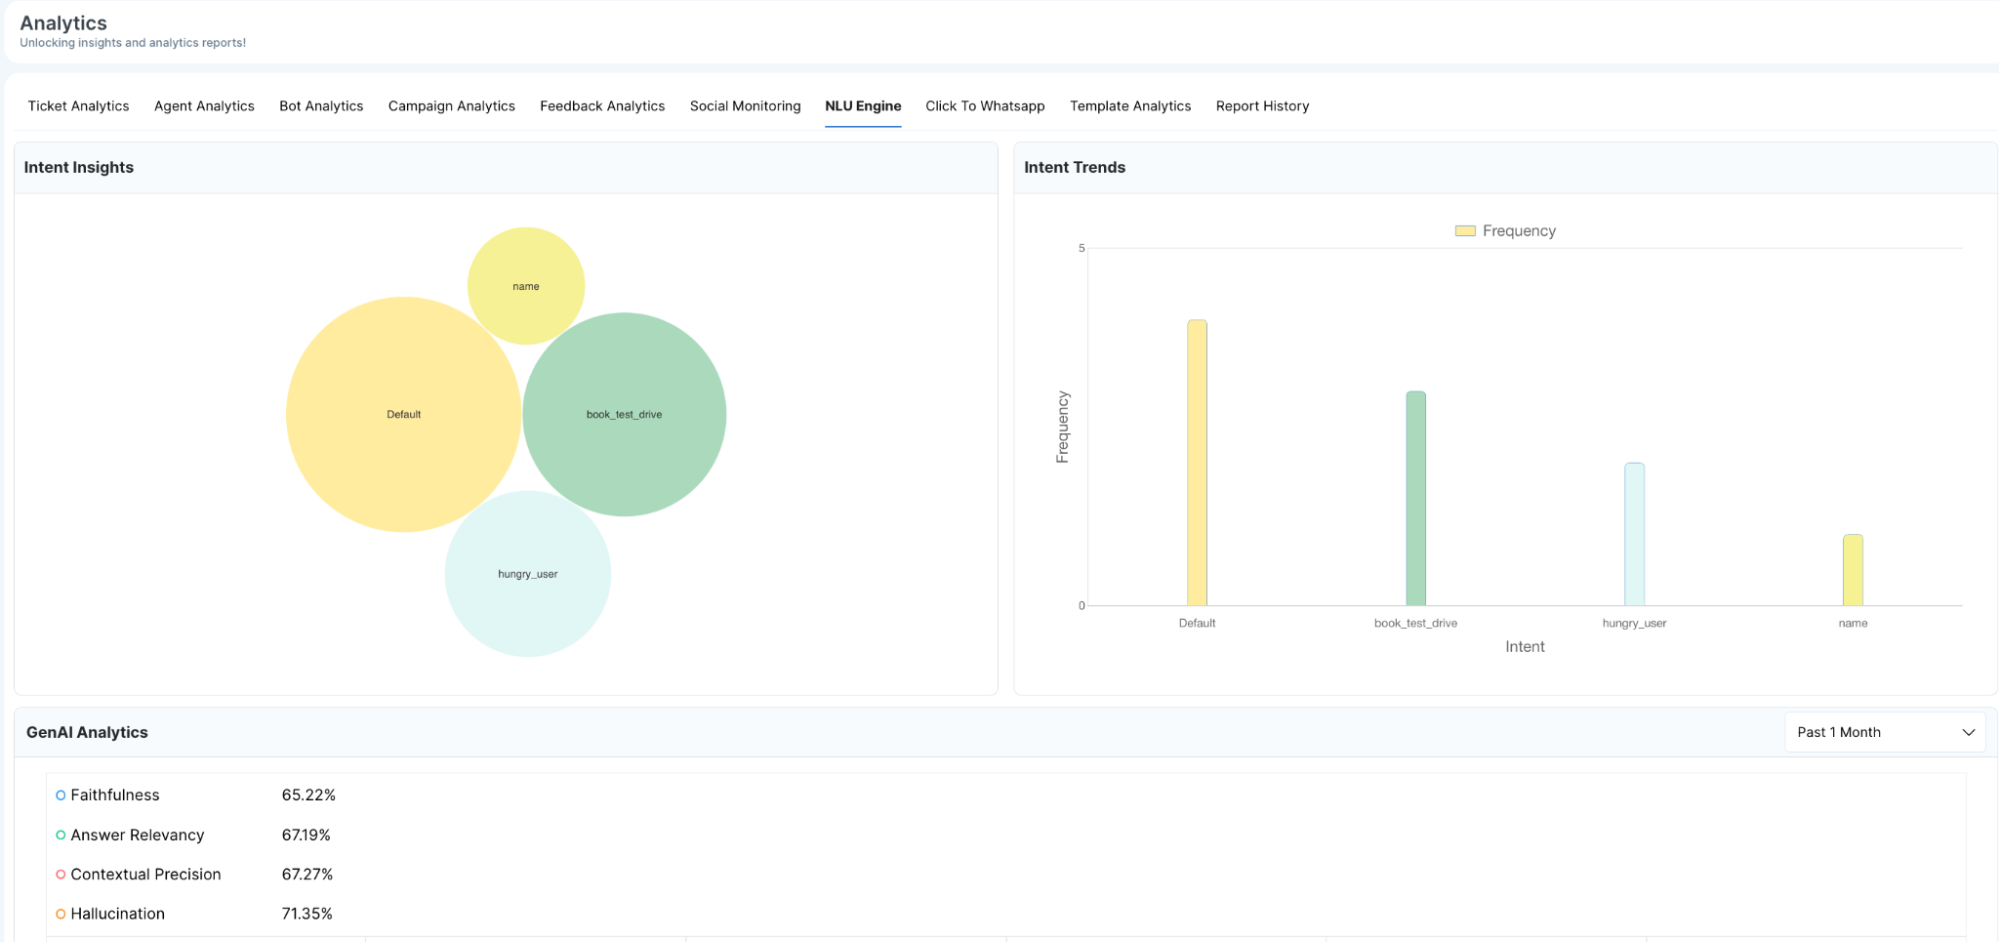
Intent Insights
- Bubbles: Each bubble corresponds to a distinct intent (for example,
book_test_drive,hungry_user). - Size: The area of the bubble grows with the number of times that intent was detected over the chosen period, making high-volume intents instantly identifiable.
- Labels: Intent names are clearly displayed on or near each bubble to help you correlate patterns without cross-referencing tables.
-
Intent Trends
- X-Axis: Lists intent names in a consistent order for easy comparison.
- Y-Axis: Quantifies how many times each intent was triggered, enabling you to spot usage spikes or declines at a glance.
- Bars: Vertical bars rise in proportion to intent volume, with tooltips showing exact counts when you hover over them.
- GenAI Analytics
- Faithfulness: Measures how closely AI responses adhere to source data, ensuring factual integrity.
- Answer Relevancy: Assesses whether the generated answers address the user’s question directly and meaningfully.
- Contextual Precision: Evaluates the AI’s ability to maintain conversation context across multiple turns.
- Hallucination: Tracks the rate at which the AI introduces unsupported or irrelevant content.
- NLU Engine Queries
- Namespace: Indicates the context or domain (e.g., “sales”, “support”) under which the query was handled.
- Query: Captures the exact user input text for precise auditing.
- Answered: A binary flag (Yes/No) showing whether the engine supplied a valid response.
- Response: Displays the AI’s returned text, letting you verify correctness immediately.
A bubble chart illustrates which intents the engine recognizes and their relative frequencies:
A bar chart tracks the activation frequency of each intent over time:
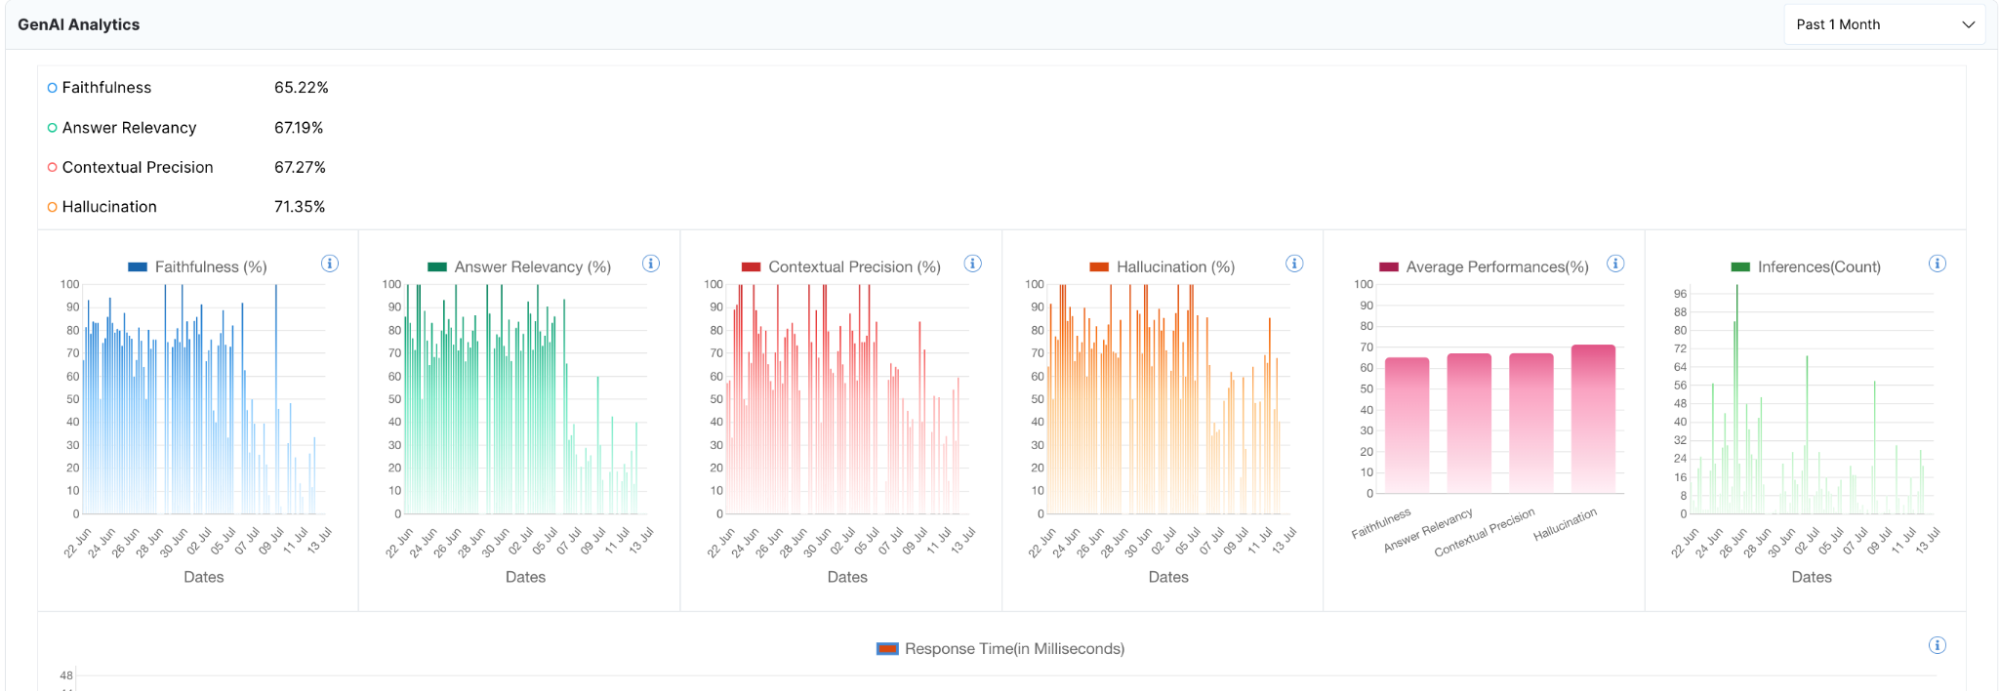
Performance metrics for the Generative AI component, each shown with a current percentage and its trend over time:
A consolidated bar chart displays the average across all four KPIs, giving a quick snapshot of overall generative quality.
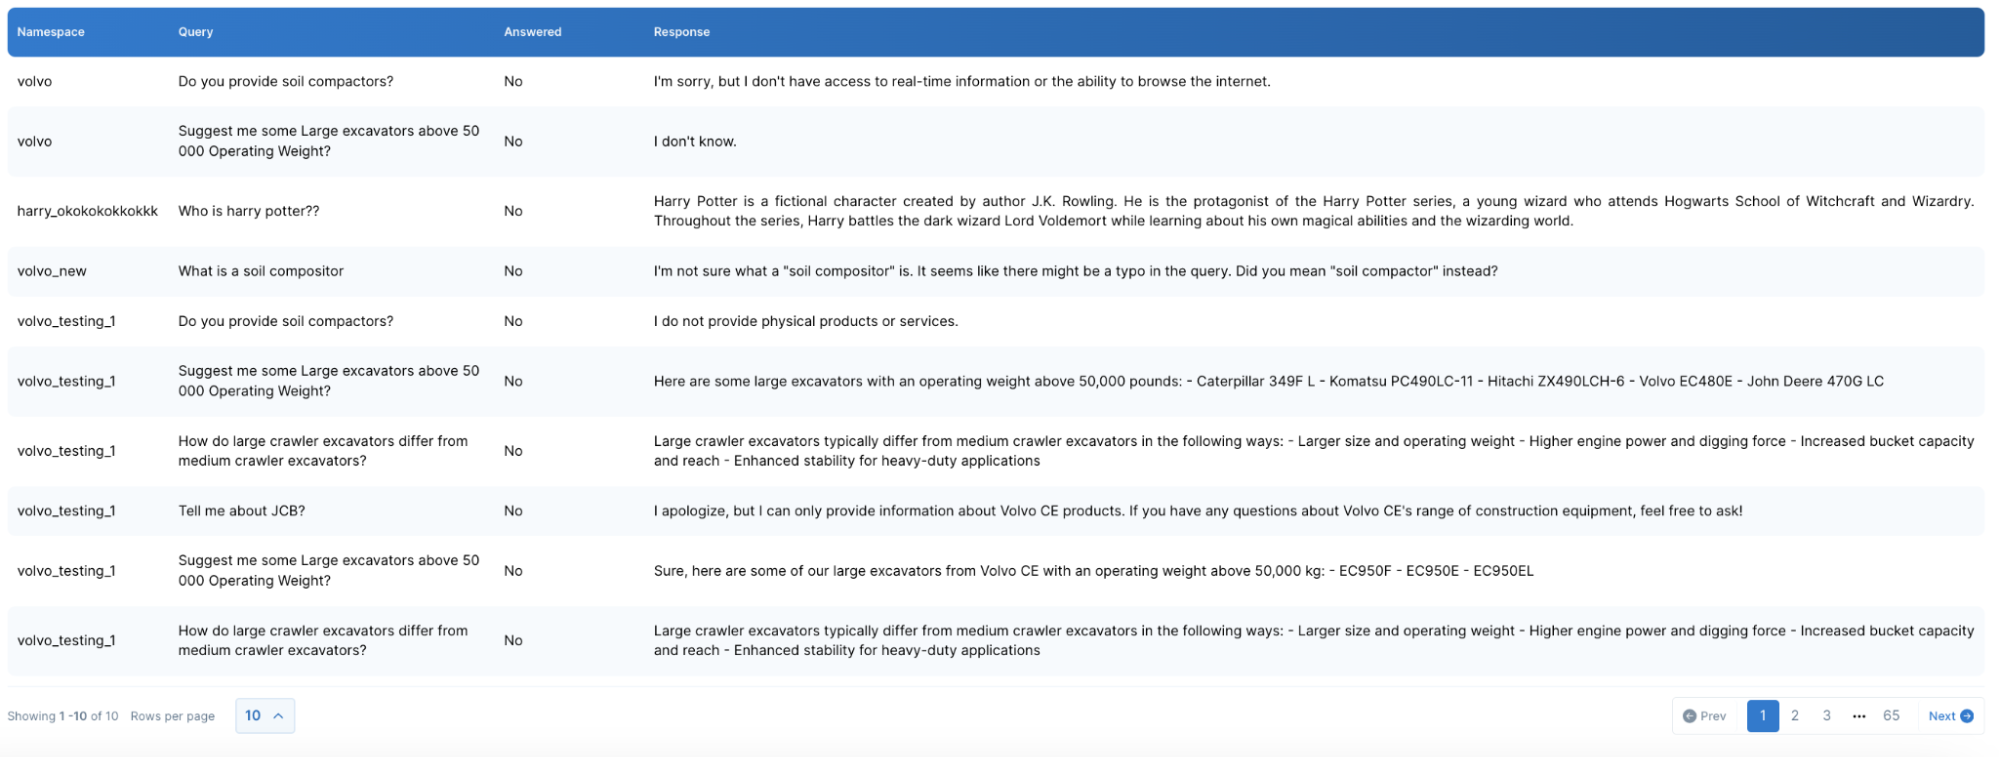
A comprehensive log of every processed query, with key details:
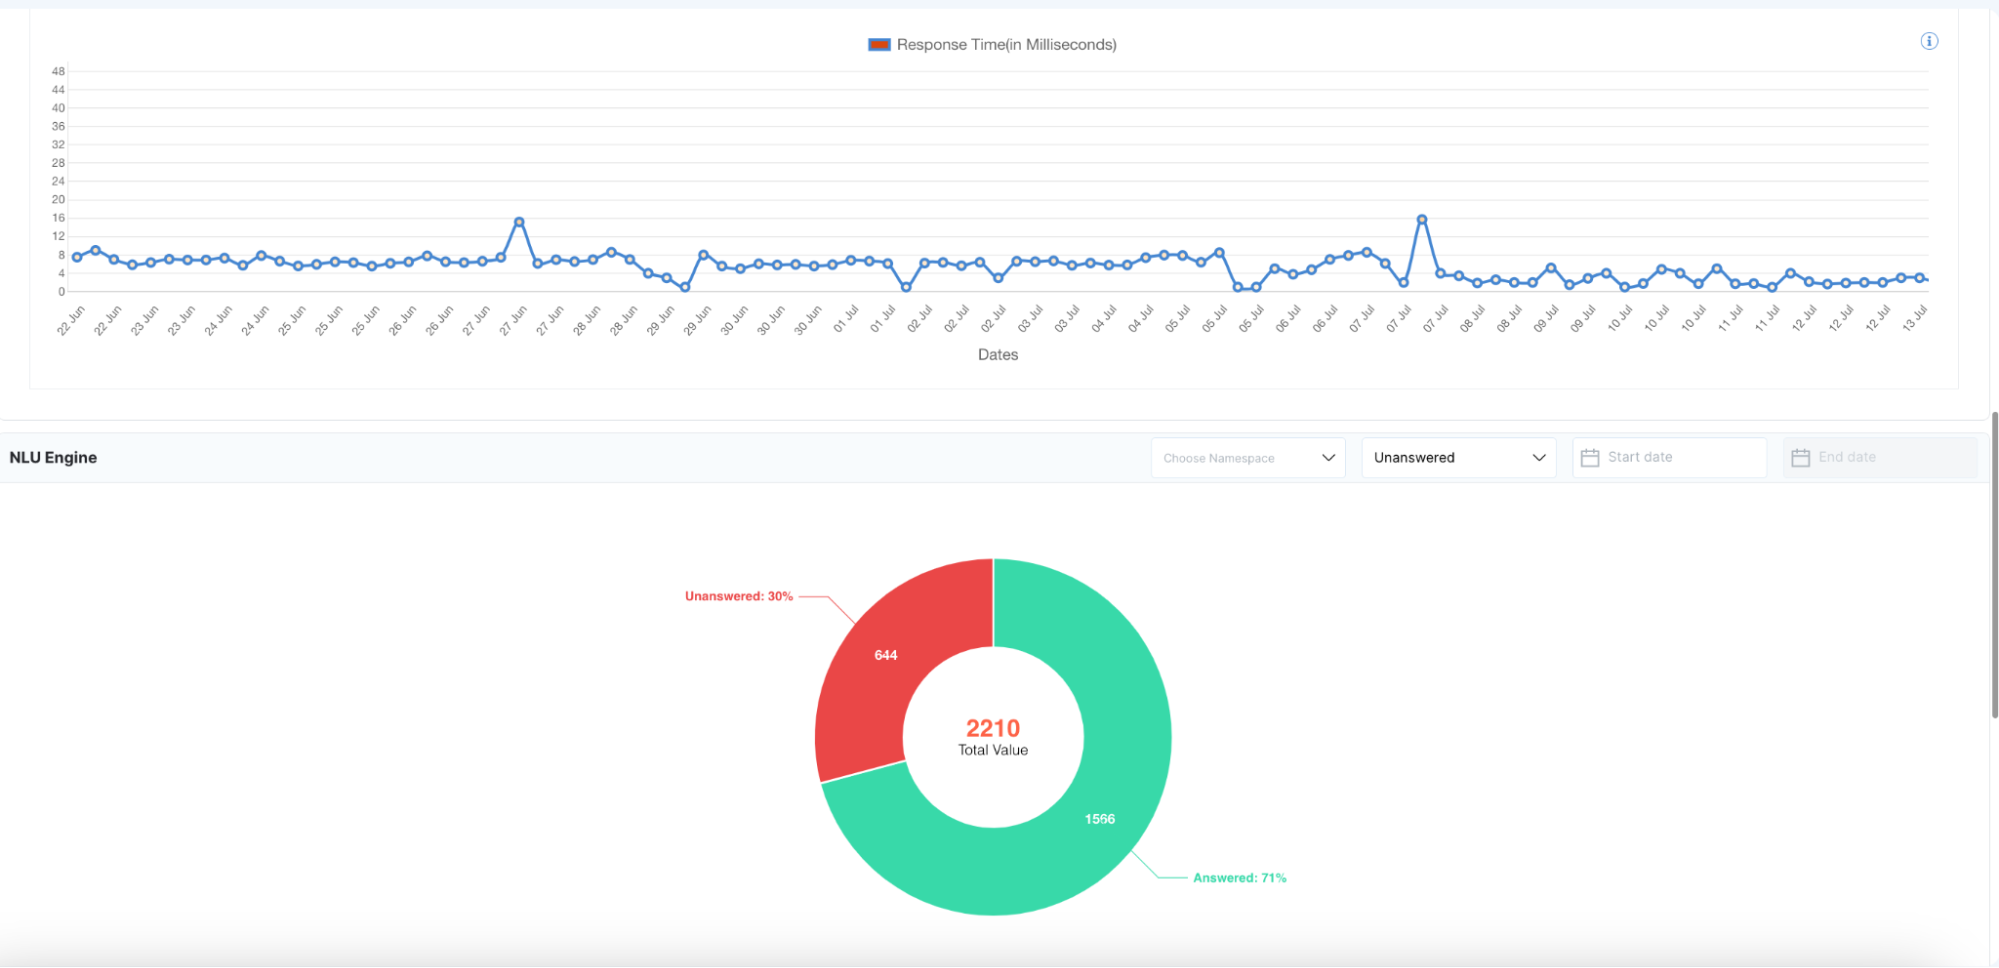
A pie chart summarizes the answered vs. unanswered distribution, so you can quickly identify coverage gaps and prioritize training for unhandled user questions.
-
Additional Metrics
- Inferences (Count): Logs the total number of inference calls the NLU engine made within the selected timeframe, helping gauge system load.
- Response Time (ms): Reports the average processing time from user utterance to AI reply, measured in milliseconds, highlighting any latency issues.
-
Controls & Filters
- Date Range Selector: Choose from presets like “Last 7 days” or “Past Month,” or define custom start and end dates to focus your analysis.
- Namespace Filter: Drill down to a specific domain or model namespace to isolate performance by use case.
- Answer Status Filter: Toggle between answered, unanswered, or all queries to zero in on gaps in coverage.
- Refresh: Click the refresh icon to reload with the latest available data without leaving the page.
- Download: Export tables and charts as CSV or image files for external reporting and deeper offline analysis.
-
Usage Tips
- Optimize Training Data: Use Intent Insights to pinpoint low-volume intents that may need more labeled examples to improve recognition.
- Monitor for Drift: Watch Intent Trends for any abrupt increases or decreases, which could indicate shifting customer needs or gaps in your model.
- Refine Generative Models: Track GenAI Analytics KPIs regularly to spot rising hallucination rates or dips in relevancy, and then retrain or adjust prompts accordingly.
- Address Coverage Gaps: Review NLU Engine Queries for frequent unanswered questions, then update your intent definitions or knowledge base so the engine can handle those queries next time.