Chatbot Metrics
-
Overview
The Chatbot Metrics feature provides comprehensive insights into your bot’s performance by tracking key interaction statistics and visualizing them in both tabular and graphical formats. These metrics help you understand user engagement, measure goal success, and identify areas for improvement.
-
How to Access Metrics
-
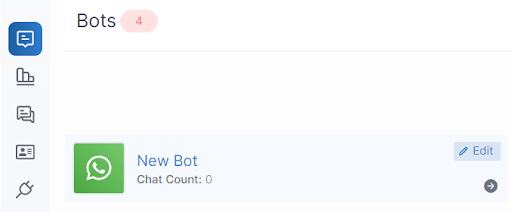
Navigate to Your Bot
- From the Chat360 dashboard, go to Admin Tools → Bots.
- Select the bot whose metrics you wish to review.
-
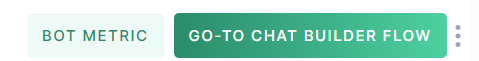
Open the Metrics Dashboard
- Click the Bot Metrics button in the top-right corner (next to Chatbot Builder).
- The metrics dashboard will load, displaying both a data table and interactive graphs.
-
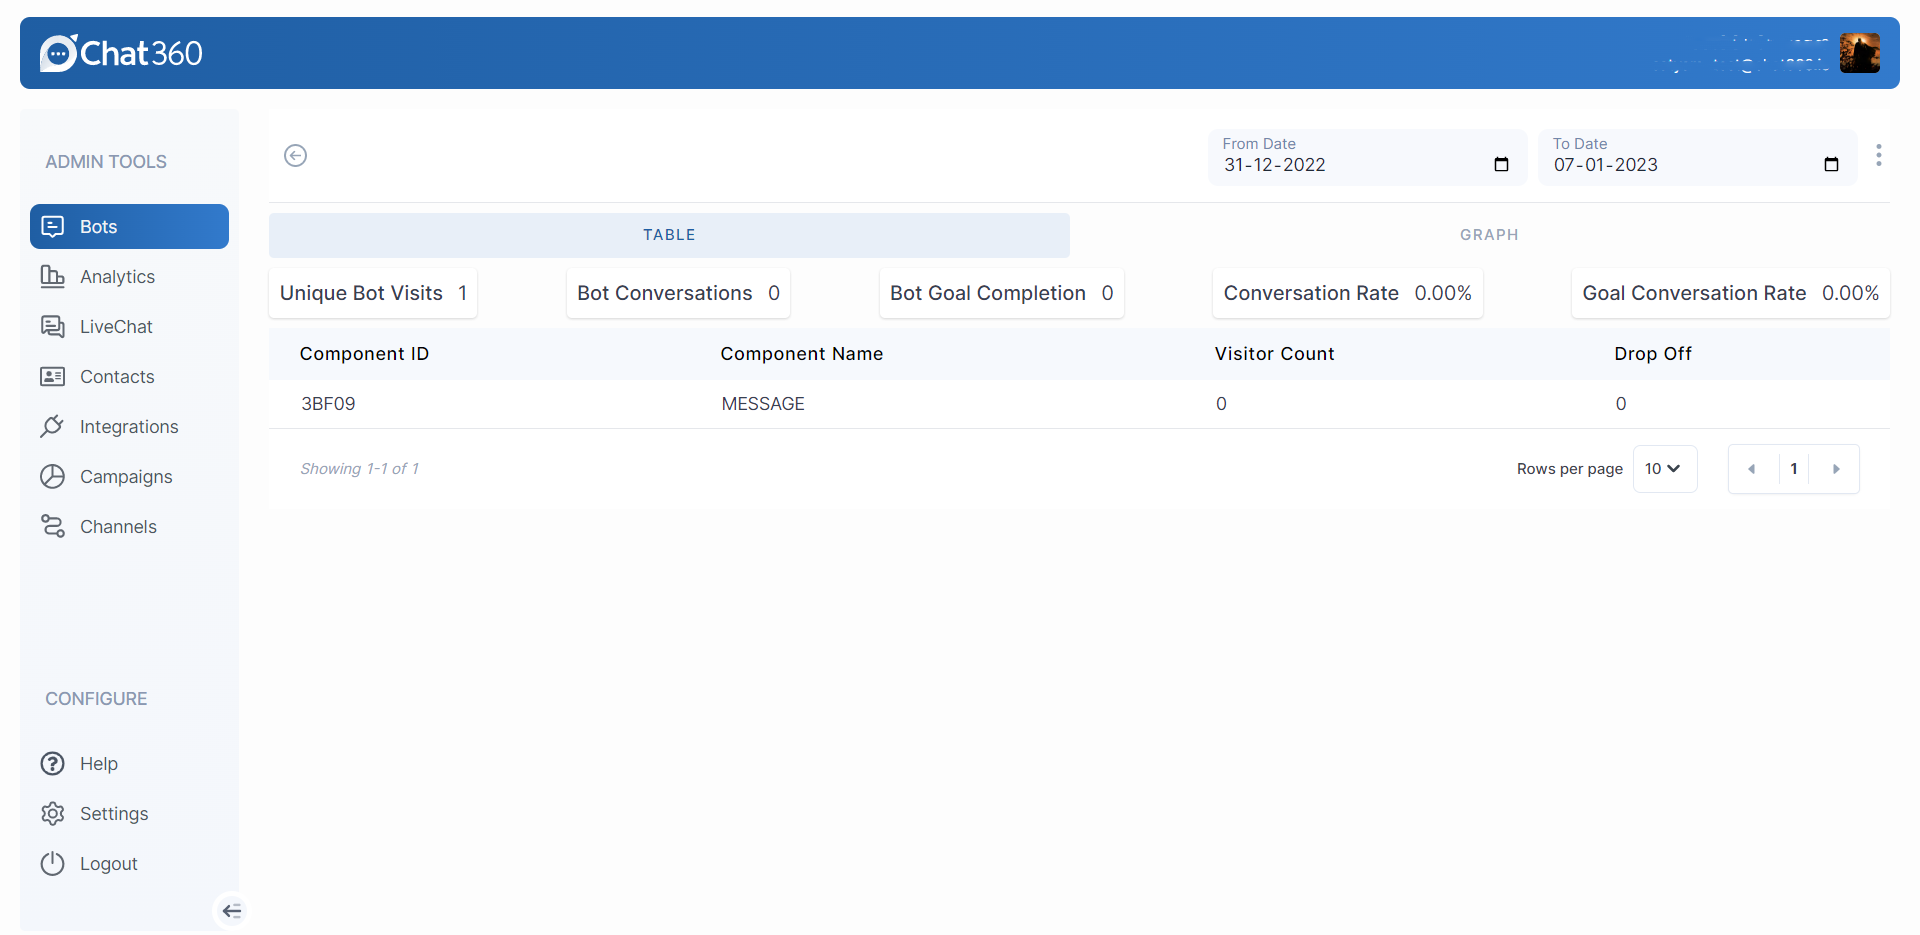
Tabular Metrics
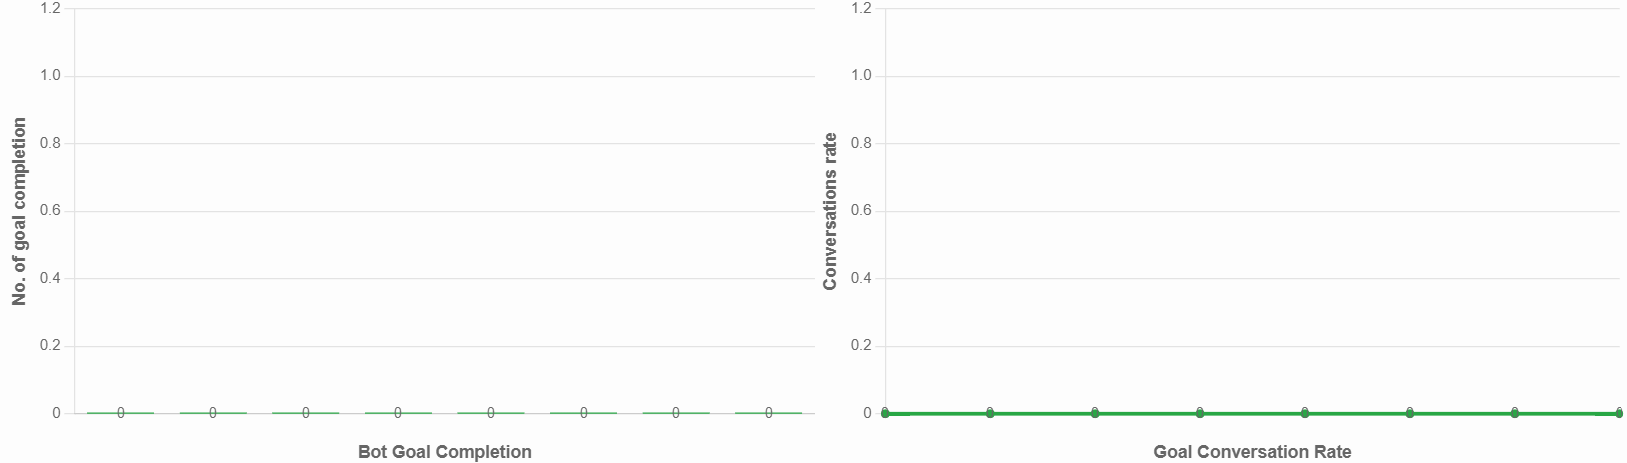
- Note: If no goals are defined, “Bot Goal Completions” and “Goal Conversion Rate” will remain blank.
| Metric | Definition |
|---|---|
| Unique Bot Visits |
Count of distinct users who have interacted with the bot for the first time. |
| Bot Conversations |
Total number of individual chat sessions initiated by users. |
| Bot Goal Completions |
Number of users who completed the predefined goals (e.g., form submission, appointment booking) set for the bot. |
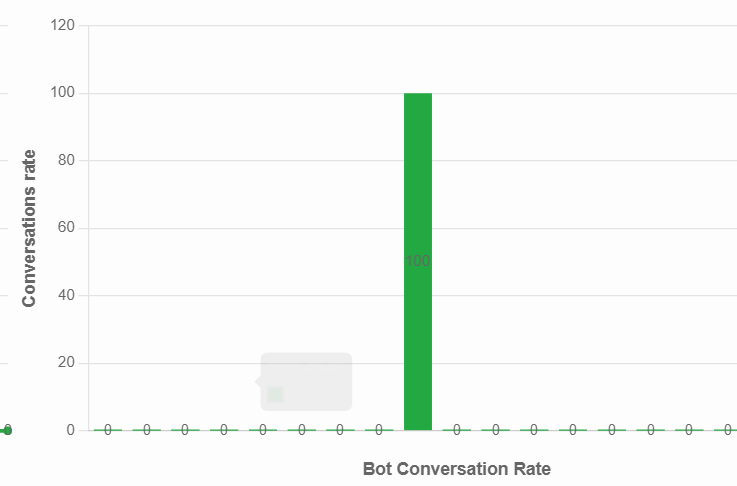
| Conversation Rate |
Ratio of total conversations to total interactions (e.g., button clicks, messages sent). |
| Goal Conversion Rate |
Percentage of conversations that resulted in a completed goal (Bot Goal Completions ÷ Bot Conversations × 100). |
-
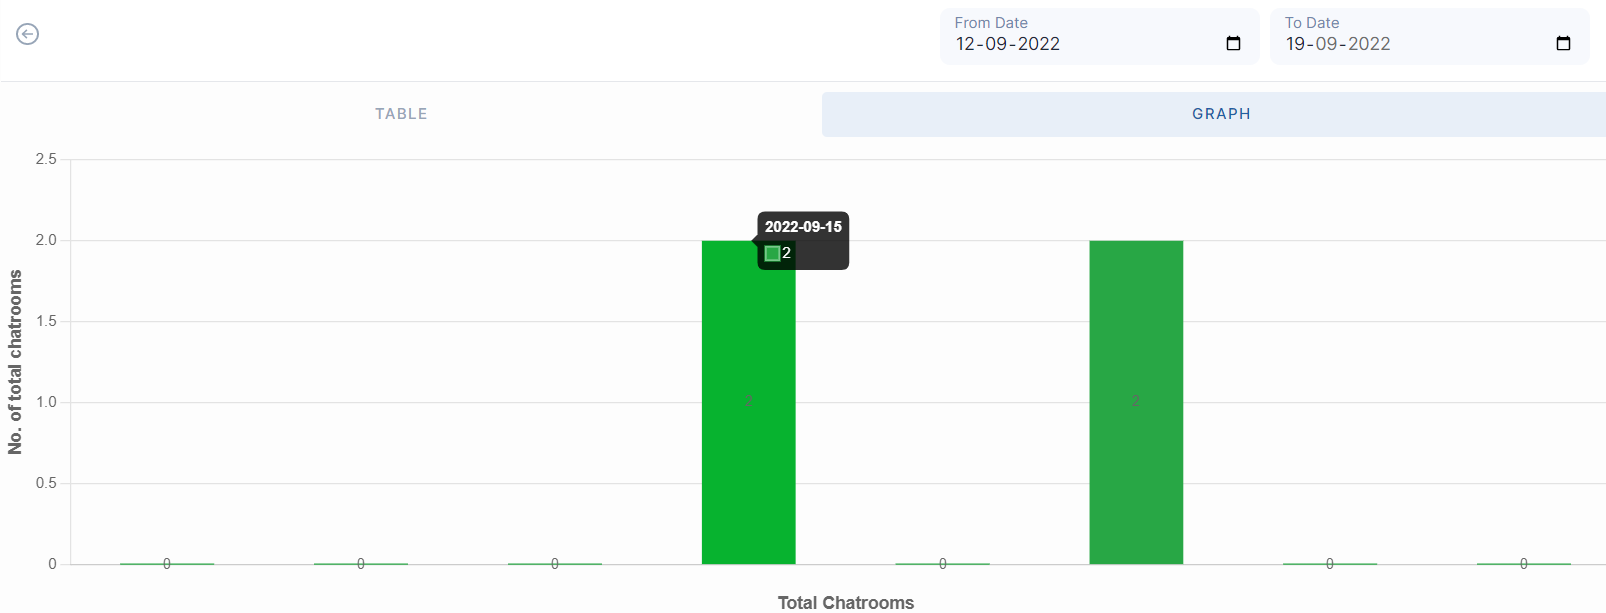
Graphical Metrics
- Bar Graph shows the number of chat sessions created each day.
- Line Graph overlays total conversation counts over the same period.
- Hover Details: Date and count for precise daily insights.
-
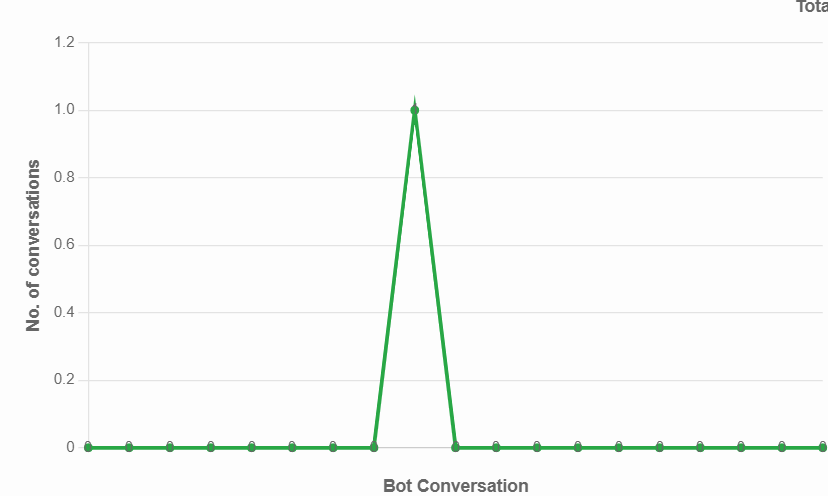
1. Chatrooms vs. Conversations
- Line Graph mapping Bot Conversations over time.
- X-Axis: Dates; Y-Axis: Conversation count.
-
2. Conversation Trend
- Line Graph or Bar Graph illustrating daily goal completions or conversion rates.
- X-Axis: Dates; Y-Axis: Number or percentage of goals achieved.
- Customize the time window to focus on daily, weekly, or monthly performance snapshots.
-
3. Goal Completion Trend
-
4. Date Range Toggle
-
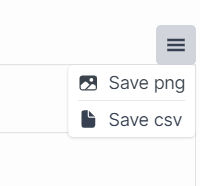
Export Options:
- Save Graphs as images for presentations.
- Download Dashboard as a CSV file for offline analysis.
-
Use Case Examples
- E-Commerce Bot Optimization: Monitor daily conversation spikes during flash sales to ensure adequate capacity and refine messaging for higher goal completion (e.g., order placements).
- Customer Support Efficiency: Track conversation rates before and after updating fallback prompts to measure improvements in handling unrecognized queries.
- Lead Qualification: Analyze goal conversion rates to assess the effectiveness of new lead-filter questions introduced in the bot flow.
Thank you for your feedback!
We appreciate your feedback!