Agent Performance Analytics
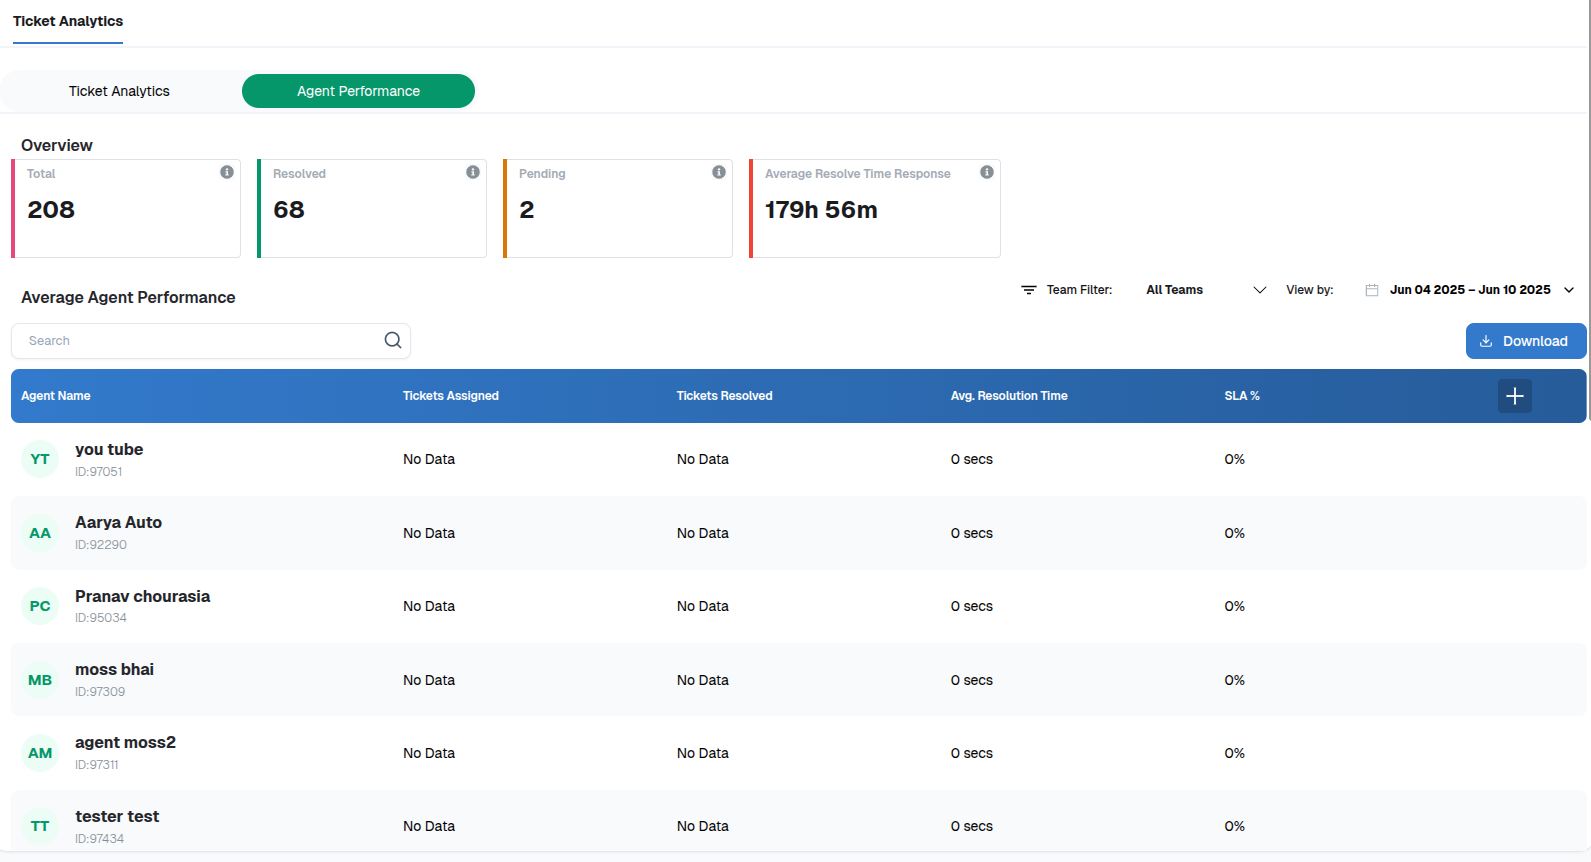
The Agent Performance tab offers a breakdown of how each agent is handling their assigned workload. This helps support managers identify top performers, those needing assistance, or any imbalance in ticket distribution.
This view includes:
- Total Tickets Assigned per agent, helping understand who is handling more load.
- Tickets Resolved shows how many issues each agent has closed, which is crucial to evaluate effectiveness.
- Average Resolution Time per agent reflects how fast they are closing tickets. For instance, an agent may average 4 hours per ticket while another might take 2 days.
- SLA % Compliance shows how many tickets were closed within expected timeframes by each agent, allowing managers to assess reliability.
The dashboard includes a search and filter function to find agents by name or ID, along with team filters if you're managing multiple support teams. There’s also a date filter to analyze agent performance over specific timeframes like this week or this month.
Lastly, you can export the entire report using the Download button at the top right of the screen to generate and share insights in Excel format.
- Why It Matters
- Tracking unresolved or aging tickets in real-time.
- Managing SLA adherence and ticket resolution speed.
- Identifying high-performing and underperforming support agents.
- Spotting service trends through volume and priority charts.
Using these dashboards, organizations can drive better support outcomes by:
Thank you for your feedback!
We appreciate your feedback!